

House Prices: Graphs, Real Prices, Price-to-Rent Ratio


In real terms – and as a price-to-rent ratio – prices are mostly back to early 2000 levels.
March 25, 2104
The S&P/Case-Shiller Home Price Indices are the leading measures of U.S. residential real estate prices, tracking changes in the value of residential real estate both nationally as well as in 20 metropolitan regions.
Nominal House Prices
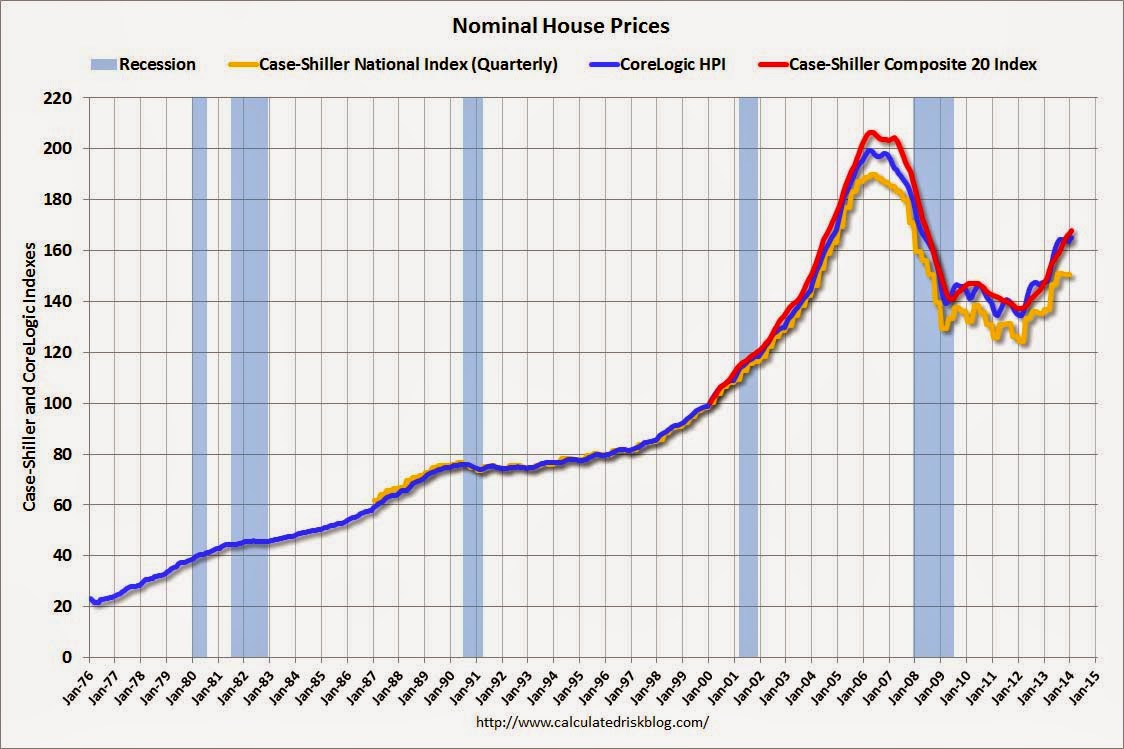
Nominal House Prices
The first graph shows the quarterly Case-Shiller National Index SA (through Q4 2013), and the monthly Case-Shiller Composite 20 SA and CoreLogic House Price Indexes (through January) in nominal terms as reported. In nominal terms, the Case-Shiller National index (SA) is back to Q1 2004 levels (and also back up to Q3 2008), and the Case-Shiller Composite 20 Index (SA) is back to Oct 2004 levels, and the CoreLogic index (NSA) is back to August 2004.
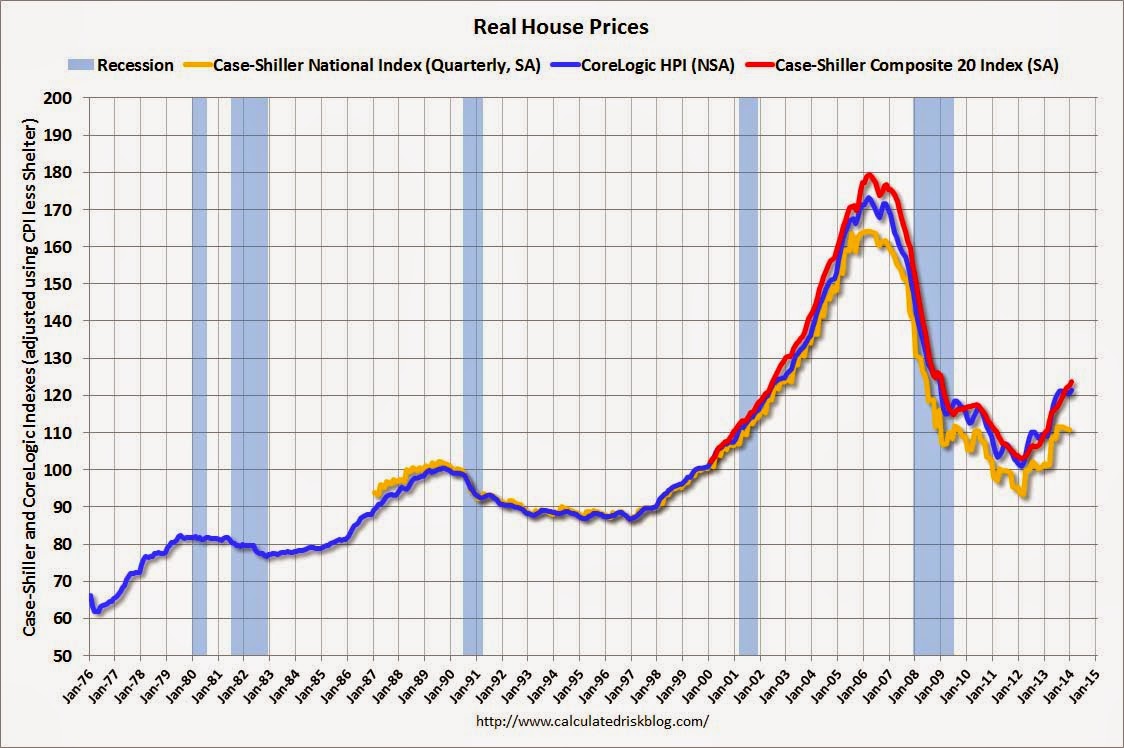
Real House Prices
Click for Larger Image
The second graph shows the same three indexes in real terms (adjusted for inflation using CPI less Shelter). It is important to look at prices in real terms (inflation adjusted). Case-Shiller, CoreLogic and others report nominal house prices. As an example, if a house price was $200,000 in January 2000, the price would be close to $276,000 today adjusted for inflation (about 38%). That is why the second graph above is important – this shows “real” prices (adjusted for inflation).
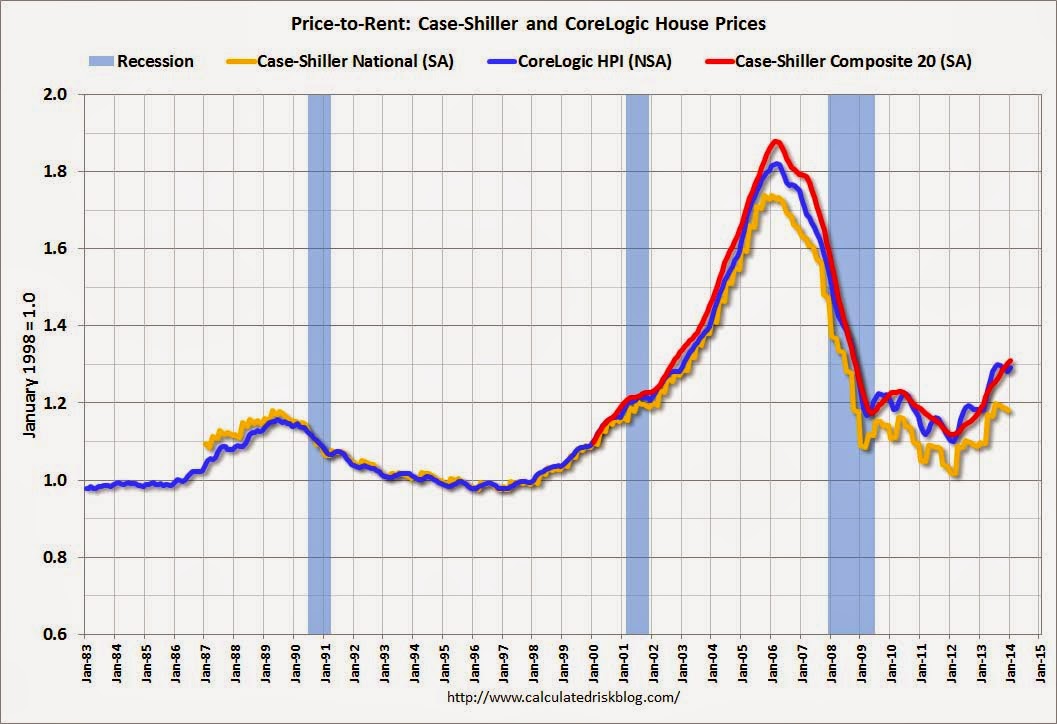
Price-to-Rent Ratio
Click for larger image
This graph shows the price to rent ratio (January 1998 = 1.0). On a price-to-rent basis, the Case-Shiller National index is back to Q2 2001 levels, the Composite 20 index is back to Sept 2002 levels, and the CoreLogic index is back to Dec 2002.
Article Link from Calculated Risk


