
House Prices: Price-to-rent, Price-to-median Household Income
There is no perfect gauge of “normal” house prices . Changes in house prices depend on local supply and demand. However I’ve found the three most useful measures of house prices are 1) real house prices, 2) the house price-to-rent ratio, and 3) the house price-to-median household income ratio. These are just general guides, but they are still useful (these are national numbers, and it is better to use local numbers when possible).
Price-to-Rent
In October 2004, Fed economist John Krainer and researcher Chishen Wei wrote a Fed letter on price to rent ratios: House Prices and Fundamental Value. Kainer and Wei presented a price-to-rent ratio using the OFHEO house price index and the Owners’ Equivalent Rent (OER) from the BLS.

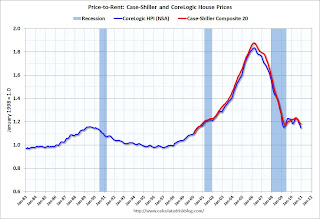
Here is a similar graph through December 2010 using the Case-Shiller Composite 20 and CoreLogic House Price Index.
This graph shows the price to rent ratio (January 1998 = 1.0).
This ratio could decline another 10% to 15%, and possibly more if prices overshoot to the downside. The decline in the ratio will probably be a combination of house prices and increasing rents (recent reports suggest rents are now increasing).
Price to Household Income

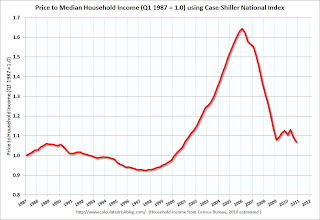
The second graph shows the Case Shiller National price index through Q4 2010 and the median household income (from the Census Bureau, Table H-8, 2010 estimated as increasing 0.5%).
This ratio is still a little high, and could decline another 5% to 10% (and more if prices overshoot). The decline in the ratio could be a combination of falling house prices and an increase in the median household income.
Real House Prices
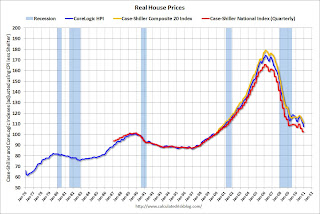
Earlier I posted real house prices using the Case-Shiller National Index, the Case-Shiller Composite 20 index, and the CoreLogic House Price Index in real terms (adjusted for inflation using CPI less shelter). Note: some people use other inflation measures to adjust for real prices. Here is a repeat of that graph:
 In real terms, the National index is back to Q1 2000 levels, the Composite 20 index is back to January 2001, and the CoreLogic index back to October 2000.
It looks like real prices could fall another 5% to 10% (more with overshoot). However what everyone wants to know is the change in nominal prices (not inflation adjusted). If real prices eventually fall 10%, that doesn’t mean nominal prices will fall that far (it depends on inflation).
My guess: Although Professor Shiller was quoted today saying house prices could fall another 15% to 25%, I’m sticking with my forecast that nominal national house prices – as measured by these repeat sales indexes – will decline another 5% to 10% from the October levels.


