
USA House Prices: Nominal, Real, and Price-to-Rent Values
Below are three graphs from Calculated Risk showing nominal prices (as reported), real prices and a price-to-rent ratio:
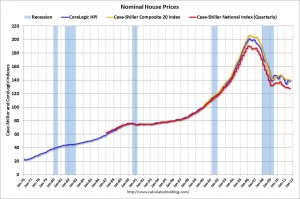
Nominal House Prices
The first graph shows the quarterly Case-Shiller National Index SA (through Q3 2011), and the monthly Case-Shiller Composite 20 SA and CoreLogic House Price Indexes (through September) in nominal terms (as reported).
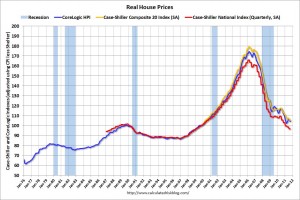
Real House Prices
The second graph shows the same three indexes in real terms (adjusted for inflation).
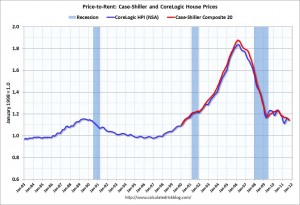
Price-to-Rent
This graph shows the price to rent ratio (January 1998 = 1.0).
On a price-to-rent basis, the Composite 20 index is back to June 2000 levels, and the CoreLogic index is back to May 2000. In real terms – and as a price-to-rent ratio – prices are mostly back to 2000 levels and will probably be back to 1999 levels in the next few months.


