

USA House Prices increased 4.3% year-over-year


Bill McBride from Calculated Risk blog provides excellent commentary and data on the US economy, labor markets, and housing. The following is excerpted from his post with the full link below.
Summary for Week ending Dec 28th
by Bill McBride on 12/29/2012 08:03:00 AM
New home sales increased to 377,000 in November and are on pace to increase 18%+ in 2012. This was a solid annual increase, and yet sales are still very weak – 2012 will be the 3rd lowest year for New Home sales since the Census Bureau started tracking new home sales in 1963. So there is still plenty of upside for new home sales over the next few years.
Case-Shiller house prices were up 4.3% year-over-year in October, and will probably be up around 6% for the year. And the 4-week average of initial weekly unemployment claims declined to the lowest level of the year – and the lowest since early 2008.
…
The first graph shows New Home Sales vs. recessions since 1963. The dashed line is the current sales rate.
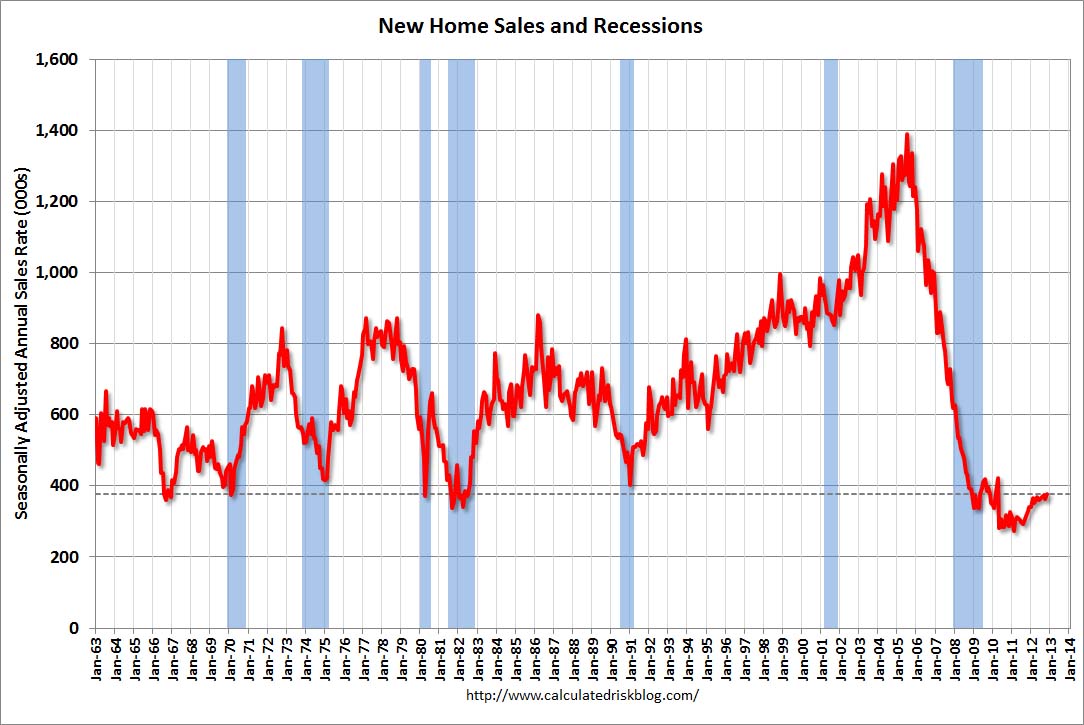
Click for larger graph
This graph shows the three categories of inventory starting in 1973.
The inventory of completed homes for sale was just above the record low in November. The combined total of completed and under construction is also just above the record low since “under construction” is starting to increase.
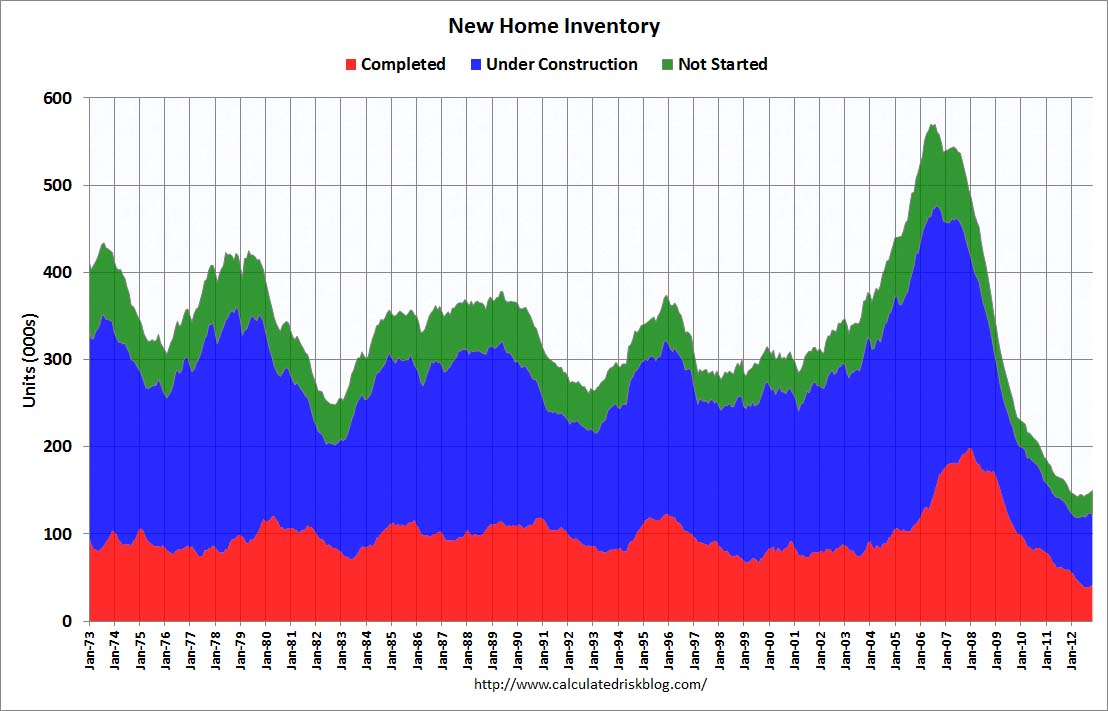
Click for larger graph
Case-Shiller: House Prices increased 4.3% year-over-year in October
This graph shows the Year over year change in both indices (the composite 10 & composite 20).
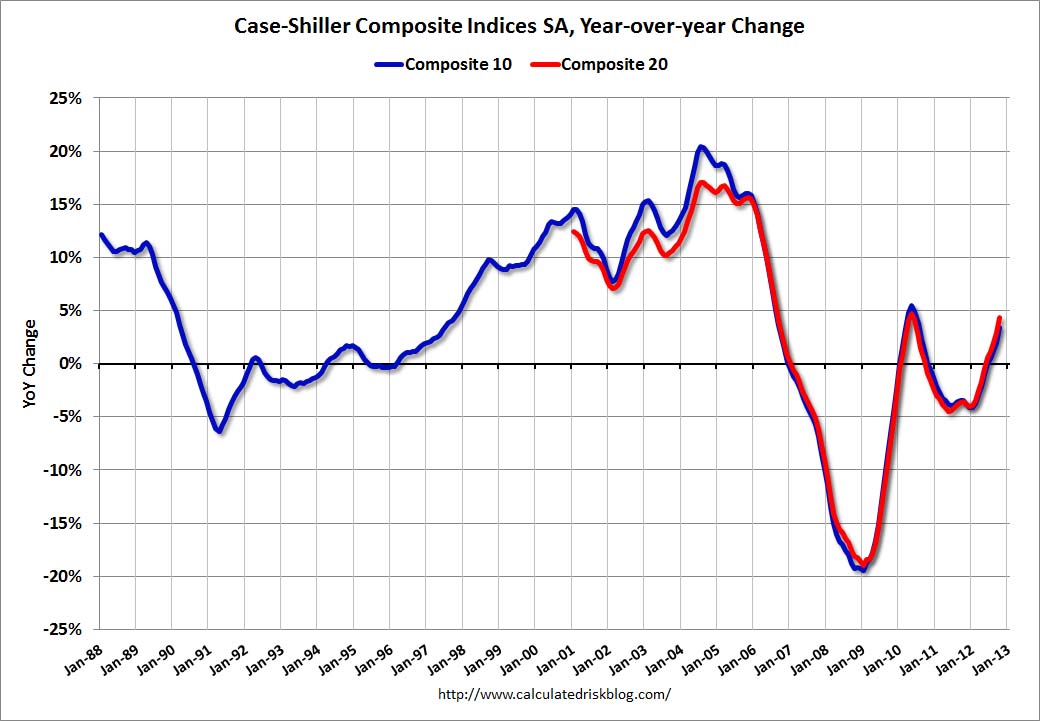
Click for larger graph
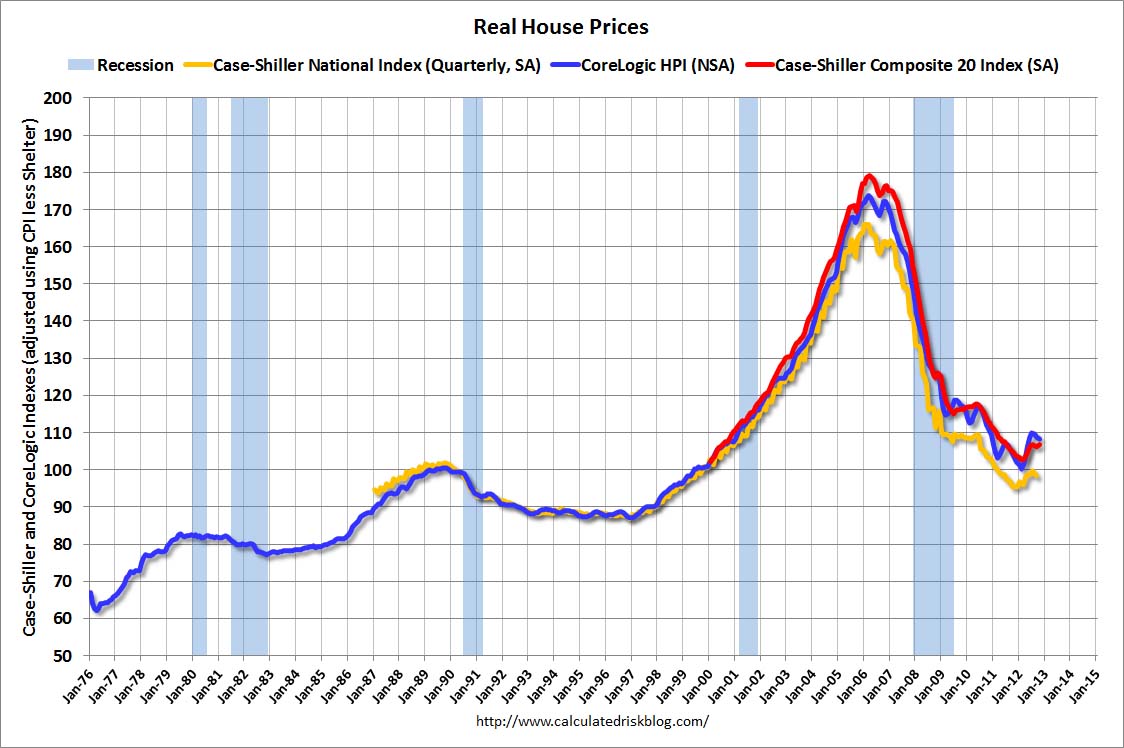
Real House Prices and Price-to-Rent Ratio
Case-Shiller, CoreLogic and others report nominal house prices, and it is also useful to look at house prices in real terms (adjusted for inflation) and as a price-to-rent ratio.
This graph shows the quarterly Case-Shiller National Index SA (through Q3 2012), and the monthly Case-Shiller Composite 20 SA and CoreLogic House Price Indexes in real terms (adjusted for inflation using CPI less Shelter). Note: some people use other inflation measures to adjust for real prices.
In real terms, the National index is back to mid-1999 levels, the Composite 20 index is back to July 2000, and the CoreLogic index back to January 2001.
Click for larger graph
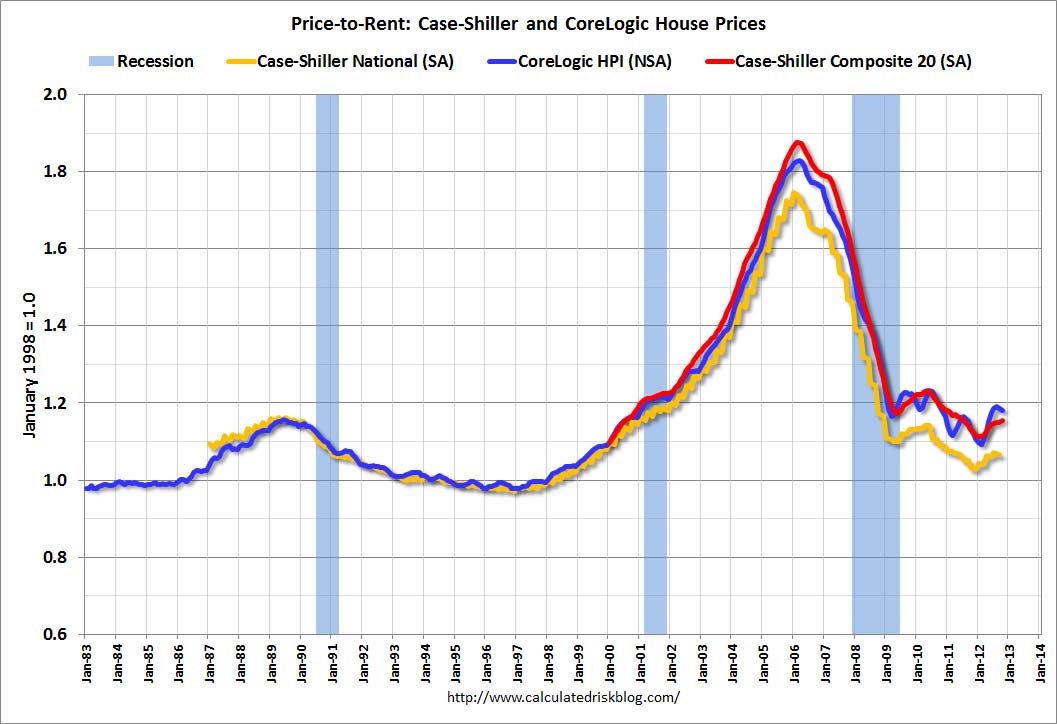
The next graph shows the price to rent ratio (January 1998 = 1.0).
On a price-to-rent basis, the Case-Shiller National index is back to Q3 1999 levels, the Composite 20 index is back to August 2000 levels, and the CoreLogic index is back to February 2001.
In real terms – and as a price-to-rent ratio – prices are mostly back to 1999 or early 2000 levels.
Click for larger graph


