
USA: Real House Prices and Price-to-Rent
REAL HOUSE PRICES
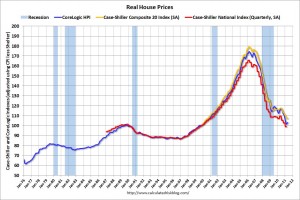
Below are two graphs showing real prices and price-to-rent ratios for residential homes in the USA. Real prices are back to 1999/2000 levels, and the price-to-rent ratio is also back to 2000 levels in real terms (adjusted for inflation using CPI less Shelter). Note: some people use other inflation measures to adjust for real prices. In real terms, the National index is back to Q4 1999 levels, the Composite 20 index is back to August 2000, and the CoreLogic index back to March 2000.
PRICE-TO-RENT
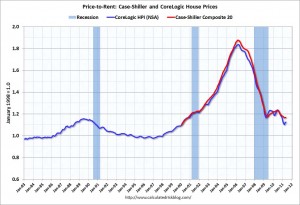
This graph shows the price to rent ratio (January 1998 = 1.0). On a price-to-rent basis, the Composite 20 index is back to October 2000 levels, and the CoreLogic index is back to March 2000. Note: the measure of Owners’ Equivalent Rent (OER) was mostly flat for two years – so the price-to-rent ratio mostly followed changes in nominal house prices. In recent months, OER has been increasing – lowering the price-to-rent ratio.


